Performance & Standards
Key Stage 2 Results 2025
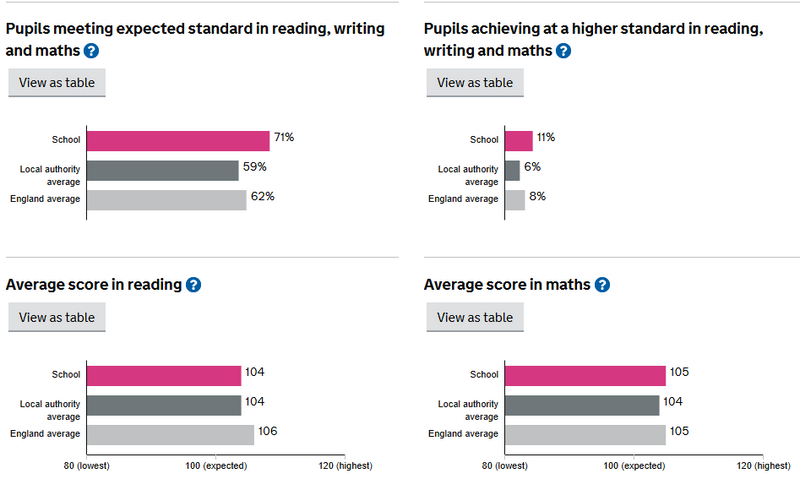
KS2 2025 Results Click here to view the DFE school performance tables website for Holton le Clay Junior School
Key Stage 1 Results 2023
of
Zoom:
Search:
Holton le Clay Infant School, Church Lane, Holton le Clay, Lincs, DN36 5AQ
Holton le Clay Junior School, Picksley Crescent, Holton le Clay, Lincs, DN36 5DR
enquiries@holton-le-clay-infant.lincs.sch.uk
01472 822065
01472 826432

KS2 2025 Results Click here to view the DFE school performance tables website for Holton le Clay Junior School